
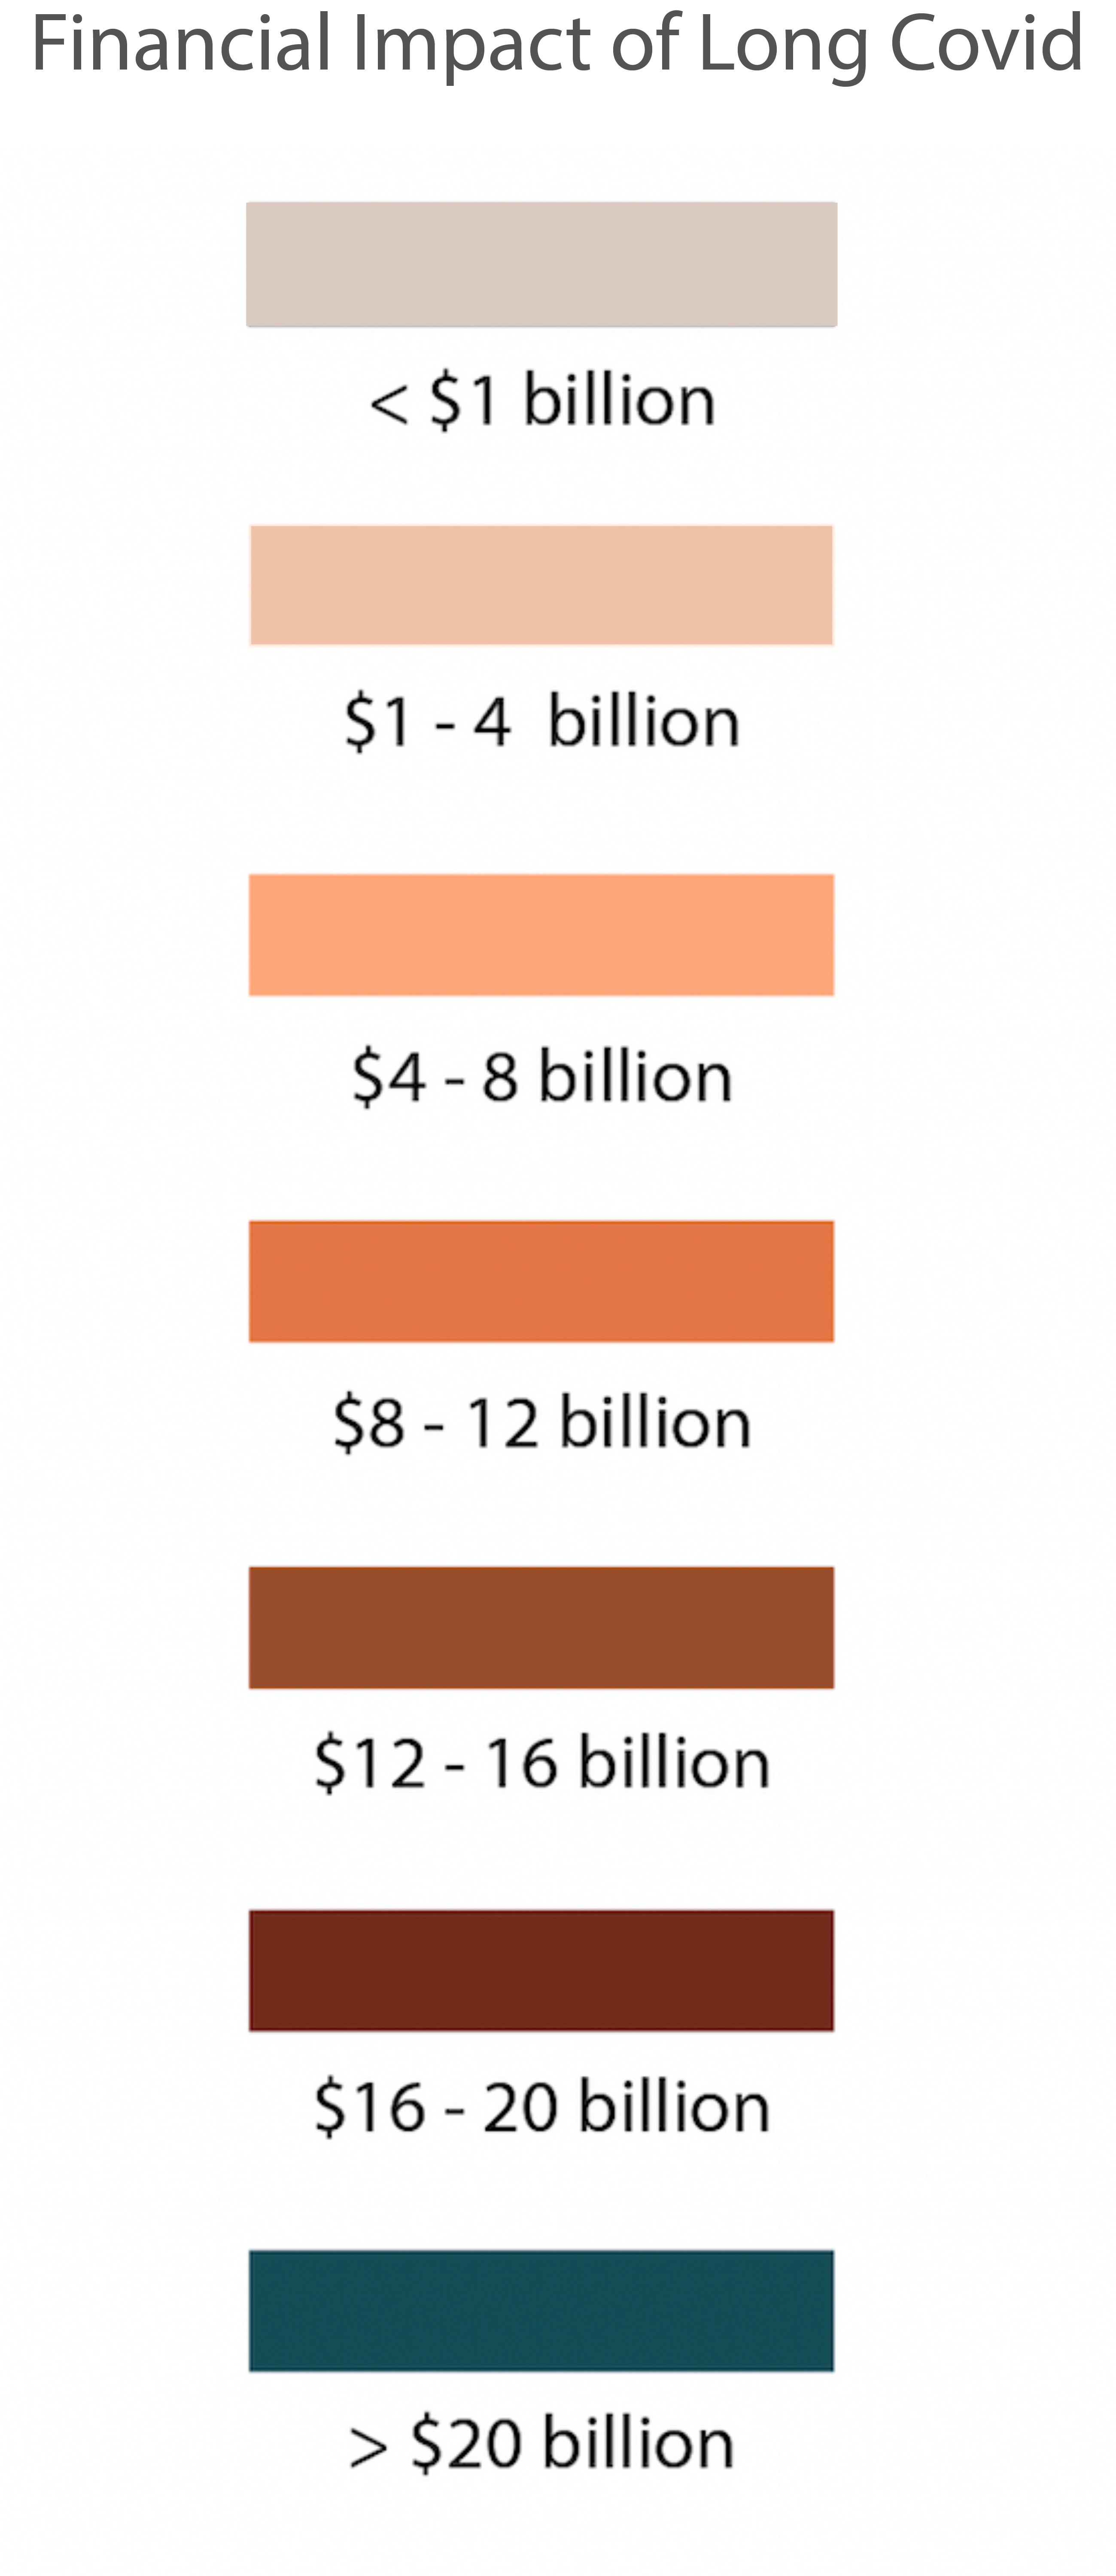
This interactive map, produced by the Solve Long Covid Initiative, supplements our whitepaper, Long Covid’s Impact on Adult Americans: Early Indicators Estimating Prevalence and Cost.
The figures represented in this map reflects data from two survey models (C-19 LAP, Whitaker) that could be used to calculate state-level data representing healthcare costs and lost earnings experienced by individuals with Disabling Long Covid, providing a glimpse into the economic impact of Long Covid on a state-by-state basis.
These are conservative estimates based on reported cases and do not reflect the potential impact of unreported cases.
Sources: C-19 LAP (2021). Mathematical Breakdown and Formulas for Long COVID Calculations. COVID-19 Long-Hauler Advocacy Project. | CDC Case Task Force (2022). United States COVID-19 Cases and Deaths by State over Time [Dataset]. Centers for Disease Control and Prevention. | Whitaker, M. et al. (2021). Persistent symptoms following SARS-CoV-2 infection in a random community sample of 508,707 people. MedRxiv [Preprint].
350 N Glendale Ave.
Suite B #368
Glendale, CA 91206
SolveCFS@SolveCFS.org
704-364-0016
| Cookie | Duration | Description |
|---|---|---|
| cookielawinfo-checkbox-analytics | 11 months | This cookie is set by GDPR Cookie Consent plugin. The cookie is used to store the user consent for the cookies in the category "Analytics". |
| cookielawinfo-checkbox-functional | 11 months | The cookie is set by GDPR cookie consent to record the user consent for the cookies in the category "Functional". |
| cookielawinfo-checkbox-necessary | 11 months | This cookie is set by GDPR Cookie Consent plugin. The cookies is used to store the user consent for the cookies in the category "Necessary". |
| cookielawinfo-checkbox-others | 11 months | This cookie is set by GDPR Cookie Consent plugin. The cookie is used to store the user consent for the cookies in the category "Other. |
| cookielawinfo-checkbox-performance | 11 months | This cookie is set by GDPR Cookie Consent plugin. The cookie is used to store the user consent for the cookies in the category "Performance". |
| viewed_cookie_policy | 11 months | The cookie is set by the GDPR Cookie Consent plugin and is used to store whether or not user has consented to the use of cookies. It does not store any personal data. |
Please let us know more about you.
Please let us know more about you.
Please let us know more about you.
Please let us know more about you.